Free tool · no account

Body Recovery Map — what has changed in your body since you stopped drinking

Enter the day of your last drink. The body below is drawn organ by organ at its place in the window a named study measured — liver enzymes by their half-lives, brain volume at one month and one year, gut barrier at three weeks — with the study under each row and what comes next. Where nothing has been measured, the map leaves a blank.

Enter the date you stopped. The map fills as the documented windows pass.

Each percentage is how far your day count sits along that organ's documented window, not a measurement of the organ. Ember is the start of the window, water is its end.

The organ breathing is the one furthest from the end of its window.

How were you drinking?
This changes the wording and the warnings under the map, never the drawing: the studies are the studies.
Cleared.
The ledger

What has been measured, organ by organ

Brain

0%of the documented window
Measured by day 0

Nothing measured before day 3, the first point in this window.

Next measured change

Withdrawal symptoms peak at 24 to 72 hours after the last drink and can go on for weeks (StatPearls 2024; MedlinePlus).

Day 3 · September 28, 2026

The cohorts were dependent, treatment-seeking and mostly men. This window does not transfer to a moderate drinker cutting back.

Who was measured: dependent, treatment-seeking drinkers, mostly men.

Sources

Heart and circulation

0%of the documented window
Measured by day 0

Nothing measured before day 3, the first point in this window.

Next measured change

Nocturnal resting heart rate, raised while drinking, settles back within about three days of stopping (Strüven 2025).

Day 3 · September 28, 2026

The blood-pressure findings come from heavy drinkers.

Who was measured: heavy drinkers.

Sources

Liver

0%of the documented window
Measured by day 0

Nothing measured before day 14, the first point in this window.

Next measured change

Carbohydrate-deficient transferrin, a marker of heavy drinking, falls with a half-life of 14 ± 3 days once drinking stops (Stibler, Dahlgren & Borg 1988).

Day 14 · October 9, 2026

These are blood markers, not liver tissue. Whether the tissue recovers depends on how far any damage had gone — that is a doctor's measurement, not a date's.

Who was measured: heavy drinkers.

Sources

Gut

0%of the documented window
Measured by day 0

Nothing measured before day 19, the first point in this window.

Next measured change

After 19 days without alcohol, gut permeability in the dependent drinkers who had raised it came down to the control group's level; the gut bacteria were still disturbed (Leclercq 2014).

Day 19 · October 14, 2026

Nothing about the gut has been measured beyond three weeks after quitting, so the window closes there. Nothing here says the gut bacteria have recovered.

Who was measured: dependent, treatment-seeking drinkers, mostly men.

Sources

Kidneys and fluid balance

0%of the documented window
Measured by day 0

Nothing measured before day 1, the first point in this window.

Next measured change

Alcohol's effect on urine output is transient and does not cause appreciable fluid loss, so fluid balance returns within the first day (US Institute of Medicine 2005, via Polhuis 2017).

Day 1 · September 26, 2026

Nothing about the kidneys is measured after the first day, so this window is one day long.

Who was measured: mixed cohorts.

Sources

Skin

Skin — no measured timeline

No study at any interval measures skin after a person stops drinking. The NHS lists better-looking skin as a benefit of drinking less, without a timeframe. The outline is drawn dotted and never scored.

Sources

Not on this map

Measured, real, and not an organ you can paint

Three more windows the literature has dated. They are written here rather than drawn, because sleep, immunity and bone are not shapes.

Sleep

0%of the documented window
Measured by day 0

Nothing measured before day 30, the first point in this window.

Next measured change

Only limited recovery of sleep disturbance is seen in the first 30 days (Koob & Colrain 2020).

Day 30 · October 25, 2026

Many people say they sleep better within a couple of weeks; measured sleep recovers more slowly. Window closes at day 420

Sources

Immune function

0%of the documented window
Measured by day 0

Nothing measured before day 14, the first point in this window.

Next measured change

Cell-mediated immunity improved significantly after two weeks of sobriety (Tønnesen 1992).

Day 14 · October 9, 2026

Measured as skin-test responses in heavy and moderate drinkers. Window closes at day 60

Sources

Bone

0%of the documented window
Measured by day 0

Nothing measured before day 14, the first point in this window.

Next measured change

Bone-formation markers normalised within two weeks of stopping, in men who had drunk moderately for three weeks (Laitinen 1992).

Day 14 · October 9, 2026

A three-week drinking study, so a short window. Window closes at day 14

Sources
Ahead

The next three measured changes

  1. Day 1 · September 26, 2026 Kidneys and fluid balance Alcohol's effect on urine output is transient and does not cause appreciable fluid loss, so fluid balance returns within the first day (US Institute of Medicine 2005, via Polhuis 2017).
  2. Day 3 · September 28, 2026 Brain Withdrawal symptoms peak at 24 to 72 hours after the last drink and can go on for weeks (StatPearls 2024; MedlinePlus).
  3. Day 3 · September 28, 2026 Heart and circulation Nocturnal resting heart rate, raised while drinking, settles back within about three days of stopping (Strüven 2025).

The milestones page puts the day rungs on your own calendar: download the .ics file.


Share this map

The link carries your date, nothing else. Pasted into a chat or a post it unfurls with the body drawn at your day count.

What the link turns into when it is pasted:

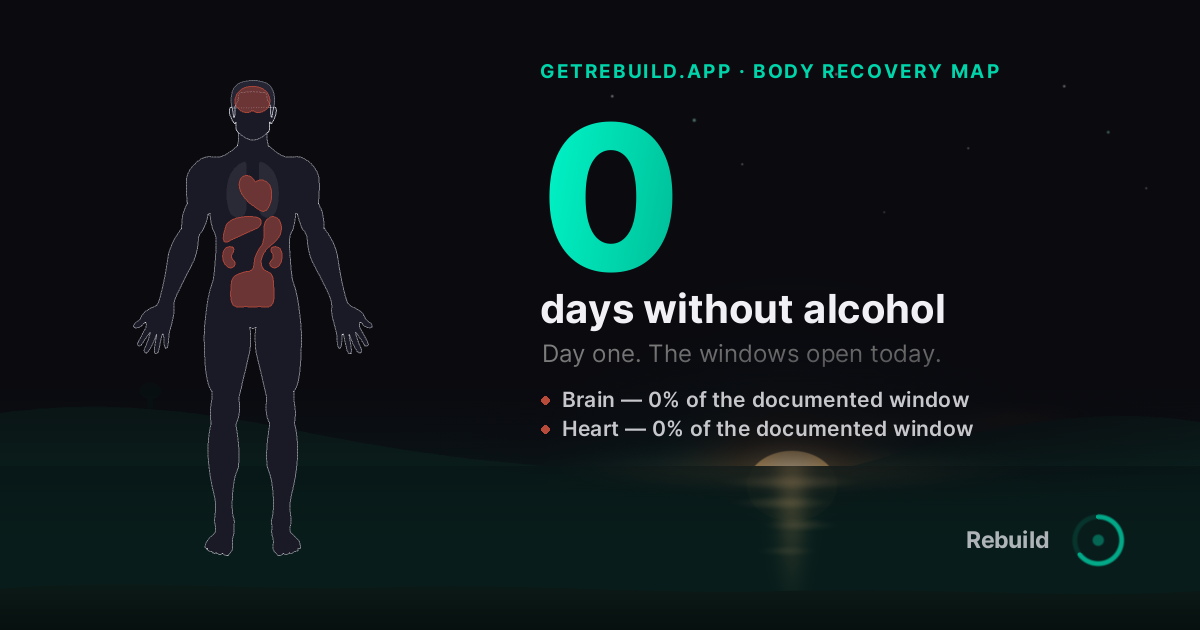
The body recovery map at day 0, drawn on Rebuild's share card
One page: the map in ink, the ledger, the next changes and the sources.

Embed this map

For a blog post or a sidebar: the body drawn at a quit date, in a frame. Change the date above and the snippet carries it.

Preview

The frame draws the map for the date in its address. The line under it is a plain link back to this page — keep it; frames pass no credit on their own.

For a blog post or sidebar

Paste where the site accepts HTML.

Free to embed anywhere. The frame carries the credit line inside it; the snippet adds the visible one under it.

For a forum signature

Forums strip frames and keep BBCode. This line links the map with your day count in it.

How this is calculated

The map counts whole days since the date you enter, the same count the sobriety counter shows. Each organ is drawn against its own window: the days at which a named study measured a change after people stopped drinking — liver enzymes by their published half-lives (CDT about 14 days, GGT about 26 days) and red-cell size over two to four months, brain volume at two weeks, one month, six weeks, seven months and one year, gut permeability at 19 days, blood pressure at one and three months in heavy drinkers, resting heart rate at three days, withdrawal peaking at 24 to 72 hours. The percentage beside an organ is how far your day count sits along that window; it is not a measurement of your liver or your brain, and it does not know how much or how long you drank. Skin is drawn as a dotted line because no study has measured skin after quitting at any interval. The studies were mostly of dependent, treatment-seeking drinkers; if you were drinking a few times a week the blood-pressure change in particular is not expected. Anything the literature does not measure is left blank rather than estimated. Sources are listed under each organ and below.

Sources

Our editorial policy explains how these tools and articles are researched and kept up to date.

Why the map is drawn this way

Every recovery timeline on the web is a list, and most of the lists were copied from the smoking-cessation clock with the words swapped. A body drawn to the studies is different in kind: each organ can only be as far along as a paper has measured, the skin has to stay blank because nobody has measured it, and the whole figure is dated to your own day rather than to a round number.

The sobriety counter keeps the same count to the second, the sobriety timeline lists the same windows as a schedule, and the recovery timeline articles take each stage a day at a time.

Asked and answered

Frequently Asked Questions

Is this an alcohol recovery calculator?
In the plainest sense, yes: it counts the days since the date you enter and places each organ on the window in which a named study measured a change after people stopped drinking. It does not calculate your liver or your brain. It cannot — it knows one date, not how much or how long you drank.
How long does the liver take to recover after quitting alcohol?
The blood markers that rise with heavy drinking fall by their published half-lives: carbohydrate-deficient transferrin in about 14 days, GGT in about 26 days, ALT and AST back in the normal range over two to four weeks, and red-cell size (MCV) over two to four months. That is what the liver window on the map is drawn from. Whether liver tissue itself recovers depends on how far any damage had gone, and only a doctor can tell you that.
How long does the brain take to recover after quitting alcohol?
In imaging studies of dependent drinkers, grey-matter volume starts to recover within two weeks, cortical and hippocampal volume increase after about a month, some brain-volume recovery is visible at six weeks, two regions were level with the control group only at about seven months in one study of 36 people, and white matter measured at a year is better than at two weeks. Those cohorts were dependent, treatment-seeking and mostly men, so the timeline does not transfer to a moderate drinker cutting back.
What does the percentage on each organ mean?
How far your day count sits along that organ's documented window — the span between the first and the last day a study measured a change. 60% on the liver means you are 60% of the way through the window the liver studies cover. It does not mean your liver is 60% recovered; nobody can measure that from a date.
Why is skin drawn as a dotted line?
Because no study at any interval has measured skin after a person stops drinking. A page that gives you a skin timeline is guessing. The map leaves skin unscored rather than estimate it.
What does before and after look like at one month, three months, six months?
Set the day count and the map draws it. At one month the liver, heart and kidney windows are well along and the brain window is at its first-month measurement; at three months the liver, heart and gut windows are complete; at six months the brain window is still open, with the seven-month and one-year measurements ahead. Every date under the map is the day a study measured a change, so the before-and-after is dated, not imagined.
I drink a few times a week, not every day. Does the map apply to me?
Partly. The blood-pressure change in the heart window comes from heavy drinkers and is not expected at two drinks a day or fewer; the brain and gut windows come from dependent, treatment-seeking cohorts. Choose "a few a week" above the map and the rows say which findings do not transfer. What no study has measured for lighter drinkers is left blank, not estimated.
Is it dangerous to stop drinking suddenly?
It can be. If you drink heavily or every day, the NHS says it can be very dangerous to stop drinking suddenly — get medical help before you stop. Withdrawal seizures are most common in the first 48 hours, and delirium tremens most often starts 48 to 96 hours after the last drink but can begin 7 to 10 days later. The map shows this warning, with your local emergency number, to anyone who says they were drinking heavily every day and is inside the first 72 hours.

Sobriety Day Counter

Days, hours and seconds since your last drink, counting live, with the next milestone already in view.

Sobriety Timeline

Your quit date in, and every recovery milestone your body has already passed, with what comes next.

Sobriety Milestones

Your quit date in, and every milestone with the calendar date it lands on — plus a calendar file and a card.

Go deeper

recovery timeline · 6 min read

3 Days No Alcohol: What Happens in Your Body at 72 Hours

3 days without alcohol: withdrawal peaks 24–72 hours after the last drink, sleep is rough, liver enzymes start to fall. What is normal, when to get help.

recovery timeline · 7 min read

1 Month No Alcohol: The Benefits Are Getting Real

One month without alcohol brings deep, systemic change — in your liver, brain, sleep, weight, and emotional health. Here's what to expect at 30 days.

recovery timeline · 6 min read

Liver Recovery After Stopping Drinking: A Timeline

How long does the liver take to recover after stopping drinking? Here's the week-by-week and month-by-month timeline of liver healing.

In the app the map follows your log, not just a date

A drink moves an organ back by a measured amount instead of resetting it, and the least-recovered organ tells you what to protect today.

Free to use — no account required